INSIDE
RACING
T E C H N O L O G Y
IRT Home
IRT Home
News Page
Contents Page
Newsletter &
Books
email Paul
The Test
A Test Using the Shaker Rig
"We ask the teams to bring the setup we use for the test," Hedlund continues. "Typically they'll come prepared to look at spring and shock variables for a specific corner at a specific track. They know their speed in that corner and they may know the wheel vertical loads or total suspension movement. If not we can calculate that. Then we set our downforce actuators to maintain the loads in that corner at that speed.
"We don't feel using track-data for a whole lap as input to the car is the right thing to do. For most of a lap the car is working fine. We'd prefer to work on areas of the track the teams identify as giving them a problem. We can help them identify problem areas if they have track data that is accurate enough. But this type of analysis can be time consuming.
"What's different about the way we test is how we input energy to the car. There's a random element to it. The rams move each wheel with randomly distributed displacements creating a phase difference front-to-rear, left-to-right, and diagonally to simulate moving over track irregularities. We also prefer long test runs to allow accurate data analysis. Ours is 80 seconds.
"When a ram moves a tire it moves through some displacement in some time. The slope of a graph of displacement vs. time is speed, inches per second for instance. Our input program randomly changes the slope of that curve in sharp steps during the 80-second run. We run a low-speed test where the maximum vertical speed is 4 in/sec and a high-speed run with Vmax at 10 in/sec.
"There are two disadvantages to frequency-sweep inputs. The hydraulics can't control the rams much over 30 Hz and a sinusoidal input just isn't a realistic input spectrum. We think our proprietary random velocity input is more realistic, the energy spectrum is very close to what you typically see in track data. Every time the velocity input to the wheel changes it kicks some energy into the car. And the frequency of the input can go much higher than with a sinusoidal input.
"A tire is a complex viscoelastic system. We think there are things to learn about the tires at inputs over 40 Hz. You want to excite the car over a wide frequency range so any important dynamics in the tire or dampers will show in the data."
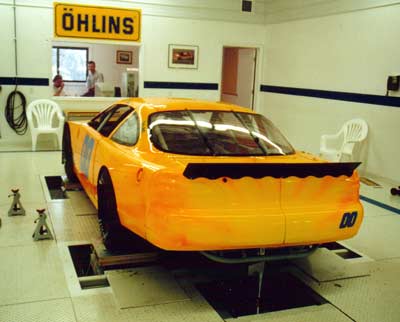
This Late Model Stock Car was tested using a setup and wheel loadings for a lightly-banked, half-mile asphalt track near Greenville, So. Carolina. This is a 3,100 pound car mounting bias-ply, spec tires. The owner told Mats the bank angle and the car speed in the turn. This allowed him to make some calculations and come up with static loadings for each of the rams on the rig. The rig can hold these loadings so the car sees force similar to those during an actual lap on that track.
Hedlund and Hesling space the wheel pads properly, push the car on the pads, and go down below floor level to attach the downforce actuators. Accelerometers are mounted on the wheels with a rigid adhesive.
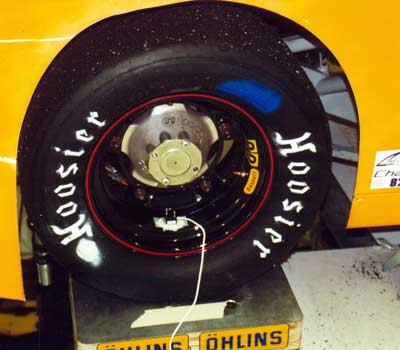
This photo shows a wheel/tire sitting on a one of the hydraulic rams. An accelerometer has been glued on the wheel. The masking tape on the pad is a reference. The tire can bounce during testing letting the whole car move around. They periodically used a jack to reposition the tires on the pads.
Mats asked the car owner some questions about the track on which he competes. He needed to know the bank angle and the car speed in the turn. This allowed him to make some calculations and come up with static loadings for each of the rams on the rig. The rig can hold these loadings so the car sees force similar to those during an actual lap on that track.
During data runs the car danced on the pads, lightly during the low-speed run and more energetically at high speeds. "This car is fairly quiet," said Hedlund. "A Winston Cup car can be very noisy. Normally we would go through a spring matrix first but the owner of this car doesn't have many spring sets. If a team is properly prepared we can make 50 to 100 runs a day. The teams learn quickly and the second or third time they come, the test can be very focused."
In between data runs Hedlund changed settings on both dampers at the front or rear of the car. Starting with all the dampers four clicks from full hard, the next run tested the front dampers two clicks softer. Testing continued making two-click damper adjustments until all front/rear combinations were covered.
"Frequency Sweep" Explanation
I need to add some explanation about how shaker rigs input energy to the cars. Mats alludes to "frequency-sweep inputs" above. Using this method the rams start off moving slow with large displacement and increase the frequency of the movement at the same time using a smaller total displacement so that the maximum velocity of the ram remains the same. Watching a test using this method the car starts off with the wheels moving up and down with large movements and as the rams speed up the displacements get smaller until the car is vibrating on the tires.
There are at least two additional subsets to this method. Using the observation that, at speed, the front tires encounter a disturbance before the rear tires you can move the rear tires a little later but on the same time/displacement curve. It makes sense to set the time difference to the speed of the corner you've decided to simulate. This is a frequency sweep with phase lag. Or you can just excite all the wheels identically.
Another excitation method is using white noise. Each wheel sees random ram displacement and speed. Again you can use a time lag between front and rear wheels or input identical signals to each wheel. Mat's method is a type of white noise. He's using a random number generator to control the slope of the displacement and speed of the rams. He can input the same signal to all the rams or use a phase lag. As he says above, during his 80 second run he uses time lags front to rear, side to side, diagonally. He processes the data statistically and comes up with some colorful graphs which we'll see in the next installment of this topic.
Contact Ohlins in No. Carolina at 828-692-4525.